Sunday, January 24, 2016
BUSINESS CYCLES

- Cycle avg. 5 - 7 years
- Recessions last approx. 14 months
- Peaks and troughs meaningless b/c we never know we are in one until
its over
Recession/Contradiction- real GDP declines for 6 months
- due to reduction in spending
- increase in unemployment
Peak- Highest point of real GDP; shows max amount of spending and min unemployment; inflation is a problem.
Expansion (recovery)- Real GDP up b/c of increase in spending and decrease in unemployment.
Trough- Lowest point of Real GDP: max unemployment and min spending
Expansion (recovery)- Real GDP up b/c of increase in spending and decrease in unemployment.
Trough- Lowest point of Real GDP: max unemployment and min spending
CALCULATIONS
Marginal Cost= New TC - Old TC
TFC + TVC = TC
AFC + AVC = ATC
TFC / Q = AFC
TVC / Q = AVC
TC / Q = ATC
AFC X Q = TFC
AVC X Q = TVC
TFC + TVC = TC
AFC + AVC = ATC
TFC / Q = AFC
TVC / Q = AVC
TC / Q = ATC
AFC X Q = TFC
AVC X Q = TVC
ELASTIC AND INELASTIC
Elasticity of demand- measure of how consumers react in change of price
Elastic Demand- demand that is very sensitive to a change in price
-product is not a necessity
- has available subs
Inelastic Demand- demand that is not very sensitive to a change in
price
- product is a necessity
- few or no subsitutes
- people will buy no matter what
Unitary Demand- (E = I)
Price elasticity of demand - PED
How to find out PED
1. Quanity (New Q - Old Q / Old Q
2. Price (New P - Old P / Old P
3. % ▲in quantity demanded / %▲ in price = PED
Total Revenue- total amount of money on a form resources from selling goods and services
- Price X quantity = total revenue
Fixed Cost- a cost that does not change or alter no matter how much is produced (rent, mortgage,)
Marginal Cost- Producing one or more of a good)
DEMAND AND SUPPLY

Demand- is quantity's that people are willing to buy at various prices
Supply- is quantity's that producers or sellers are willing and able to produce at various prices.
The law of demand- there is an inverse relationship between price and quantity demanded
The law of supply- direct relationship between price and quantity supply (P▲, Q▲)
What causes a "change in quantity demanded (▲QD) and "change in quantity supplied (▲QS)
- PRICE
What causes a "change in demand" (▲D)
1. ▲ in buyers taste (advertisement)
2. ▲ in # buyers (population)
3. ▲ in income (normal or inferior goods)
4. ▲ in price of related goods (complementary or substitute)
5. ▲ in expectations
Normal goods- items that you buy when your not ballin with extra money
Inferior gods- items that you would not normal buy unless your ballin
Complementary- something that goes with the item or completes it (hotdog and bun)
Substitute- something that replaces a object that serves the same purpose (Coke and Orange juice)
What causes a "change in supply" (▲S)
1.▲ in weather
2.▲ in number of supplyers
3.▲ in technology
4.▲ in cost of production
5.▲ in taxes and subsidarys
6.▲ in expectations
PRODUCTION POSSIBILITY GRAPH
- shows alternative waves to use and economy resources
Contains-
.two goods
.fixed resources (L.L.C.E)
.fixed technology
.full employment of resources
Efficiency- using resources in such a way as to maximize the production of goods and services
Allocate efficiency- products being produced are not most desired in society
Productive efficiency- produced in the least costly way, any point on curve.
Under utilization- fewer resources than an economy is capable of using

A) Inside curve (under utilization, attainable, inefficient
B-C) On Curve (attainable, efficient)
D) Outside curve (unattainable)
3 Types of movement that occurs withing the PPC
1. Inside the curve- resources are unemployed or underemployed
2. Along the PPC- efficient and employed
What causes the PPC/PPF to shift
1. Technological changes
2. Economic changes
3. ▲ in resources
4. ▲ in labor forces
5. Natural disasters/ War/ Famine
6. More education/ training (human capital)
Saturday, January 23, 2016
UNIT 1 INTRO
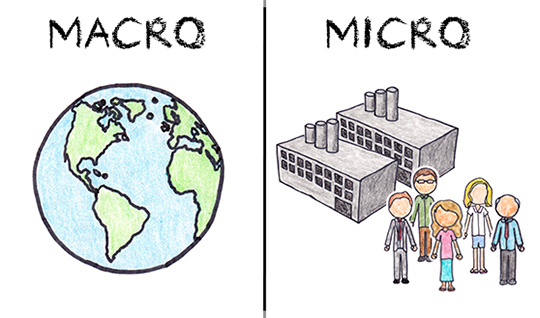
Macroeconomics- The study of the economy as a whole, i.e, inflation, international trade, or wages.
Microeconomics- The study of individual or specific units of the economy, i.e, supply and demand, market structures, or business operations.
Positive economics- Attempts to describe the world as it is, "what is", and "collects/ presents" facts
Normative economics- Describes how the world should be, "ought to be", or "should be"
Needs- basic requirements for survival (food, water, shelter, clothes)
Want- Desires of citizens
Goods- tangible commodities, Capital goods- items used in creation of other goods, Consumer goods- goods intended for final used by the consumer
Services- the providing or a provider of accommodation and activities required by the public
Security- fundamental economic problem, how to satisfy wants with limited resources
Shortage- QD > QS
Factors of production
1.Land- natural resources
2.Labor- work force
3.Capital- normal/physical
4.Entrepreneurship- innovative/ risk taker
Subscribe to:
Comments (Atom)